BI Dashboards & KPI Reporting
Interactive and executive-ready views that make performance easier to understand, monitor, and discuss.
Explore service

BhavCzar turns scattered business, marketing, and audience data into clear dashboards, reports, forecasts, and decisions you can explain.
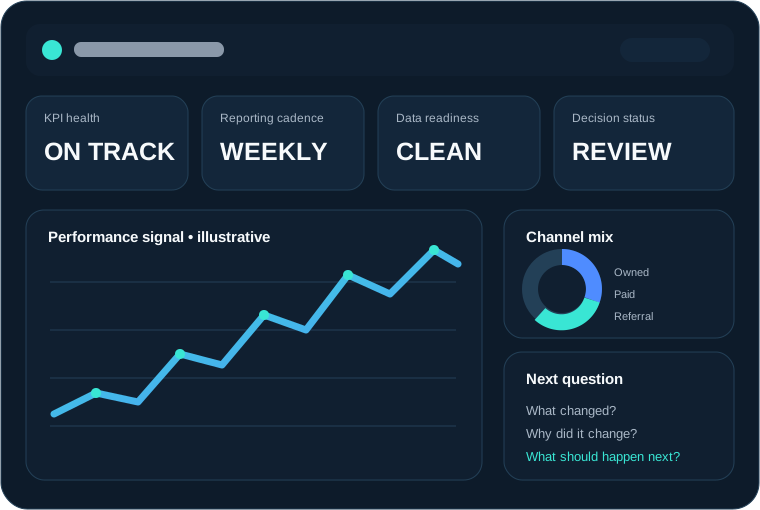
Start with the decision. Then determine what data, analysis, and reporting will make that decision clearer.
Interactive and executive-ready views that make performance easier to understand, monitor, and discuss.
Explore serviceStructure scattered files, standardize definitions, and create a reporting process people can repeat.
Explore serviceConnect campaigns, content, channels, and outcomes to identify what is driving attention and action.
Explore serviceTurn public information, customer context, and competitive signals into a practical intelligence brief.
Explore serviceBuild transparent forecasts and scenarios that support planning without hiding uncertainty.
Explore serviceStudy behavior, segments, engagement patterns, and feedback to understand who responds and why.
Explore serviceSeparate evidence from instinct, useful signals from noise, and clear next steps from vague reporting.
How the practice worksClarify the business question and what a useful answer must change.
Review the data, definitions, gaps, assumptions, and reporting habits.
Clean, connect, visualize, compare, forecast, and test only what serves the question.
Package findings into dashboards, briefs, and recommendations people can use.
The BhavCzar mark is a personal fusion of the alchemical Three Primes: Salt, Mercury, and Sulfur—reinterpreted as the three forces behind useful business analytics.
Data is the body. Analysis is the mind. Action is the soul.
Read the full story